- Yearly
- Quarterly
Overview of Business in 2015
AAPICO Hitech Public Company Limited is principally engaged in the manufacture and distribution of automobile parts, including pressed parts, forged parts, machined parts and plastic parts, as well as the design of stamping dies and assembly jigs for the automobile production. The Company also operates car dealerships and supplies car navigation system and technology under the brand “POWERMAP”.
The Company has main factories and facilities in three countries, namely Thailand, Malaysia and China.

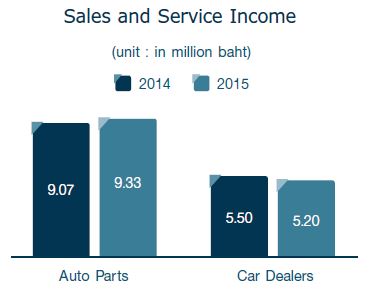
The Company’s total revenues come mainly from the automobile parts business and the car dealerships business. The revenue from car navigation system and technology was nominal and hence was included as part of the revenue from the automobile parts segment. In 2015, the revenue composition of the automobile parts and car dealership segment was at the ratio of 65:35, as compared to the ratio of 63:37 in the year 2014.
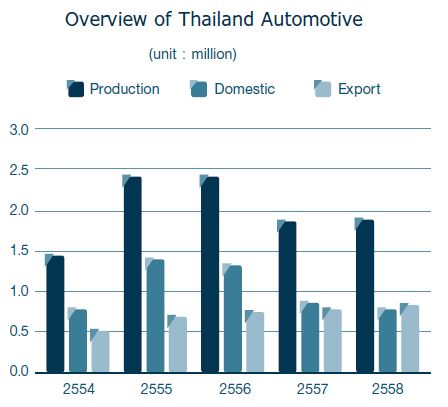
The Automotive Industry in Thailand
Total vehicle production volume in Thailand in 2015 grew marginally by 1.8% compared to 2014, from 1.880 million units in 2014 to 1.913 million units in 2015. Of this volume, the production for export was at 1.201 million units (63%) and domestic sales at 0.712 million units (37%). The production of passenger cars and commercial cars both increased year on year by 2.43% and 0.09% respectively.
Domestic demands in 2015 continued to be weak, posting a 9.3% decline year on year, driven mainly by the slowdown of economy and dampen consumer sentiments due to low agriculture produce prices, high household debts and negative effect of the 1st car campaign, with many purchases had been brought forward and hence depriving the domestic market needs and spending power. Offsetting this decline was a solid export volume growth at 6.8% year on year.
Profit and Loss Analysis
For the year 2015, the Company reported a total revenue of Baht 14,993 million and net profit attributable to equity holders of Baht 313 million, as compared to Baht 15,196 million and Baht 367 million respectively for the year 2014. The decrease of profit, and hence earnings per share, compared to last year was mainly due to lower income and foreign currency exchange fluctuation, despite improved gross profit margin, higher share of profit from associates and lower financing costs.
Revenues
| Unit : Million Baht | Y2014 | Y2015 | Change | % |
| Sales and service income | 14,572 | 14,534 | (38) | -0.3% |
| Other income | 614 | 459 | (155) | -25.2% |
| Exchange gains | 10 | - | (10) | -100% |
| Total Revenues | 15,196 | 14,993 | (203) | -1.3% |
Total revenue of the Company in 2015 decreased Baht 203 million or by 1.3% compared to 2014, primarily due to lower income from scrap sales as a result of a slump steel price and partly due to lower sales. Other income in 2014 also included a tooling income of Baht 97 million and a Baht 10 million exchange rate gain related to the derivative agreements in 2014, as compared to an exchange loss in 2015.
| Unit : Million Baht | Y2014 | Y2015 | Change | % |
| Thailand | 10,130 | 10,559 | 429 | 4.2% |
| Malaysia | 3,741 | 3,393 | (348) | -9.3% |
| China | 701 | 582 | (119) | -17.0% |
| Sales and service income | 14,572 | 14,534 | (38) | -0.3% |
Sales and service income in 2015 posted a nominal decline by Baht 38 million or by 0.3%. Solid growth was seen in Thailand at a 4.2% increase year on year, driven by the increases of vehicle production volume, which grew 1.8% year on year, and some tooling income in 2015. This growth however was offset by a sale decline in China due to the slowdown of economy and lower revenue from Malaysia which was impacted by the weaker currency translation rate as compared to 2014.
Sales and Service Income by segment
Sales from the automobile parts segment grew year on year by 2.8%, driven by higher sales in the OEM segment in Thailand and tooling income from the plastic division. This growth, however, was largely offset by lower sales of forged and machined parts in China, due to the slowdown of economy, and lower sales from assembly jigs and stamping die business.
Contrary to the growth in the automotive parts segment, sales of the car dealerhips segment posted a decline of 5.7% year on year. This decline was mainly due to the impact of weaker currency exchange rate, where Malaysian Ringgit has depreciated against Thai Baht by about 11% compared to last year. After the adjustment of this currency impact, sales grew marginally by 0.8%. A healthy growth from Honda car sales in Malaysia was largely offset by weak domestic demands in Thailand.
Gross Profit
| Unit : Million Baht | Y2014 | Y2015 | Change | % |
| Sales and service income | 14,572 | 14,534 | (38) | -0.3% |
| Cost of sales & service | 13,964 | 13,820 | (144) | -1.0% |
| Gross Profit | 608 | 714 | 106 | 17.4% |
| Gross Profit Margin | 4.2% | 4.9% | 0.7% |
Despite the sales decline, gross profit increased by 17.4% year on year. Gross profit margin improved from 4.2% of sales in 2014 to 4.9% of sales in 2015, driven by profit from tooling income and efficiency improvement.
The margin improvement was seen from the automotive parts segment, driven by tooling income profit and improved inventory control in plastic parts business. Improvement was also seen in jigs and dies products, pressed parts and forged and machined parts in Thailand, while forged parts in China reported lower gross profit, mainly as a result of lower sales.
The gross profit margin for the car dealerships segment was lower than last year, as the margin in Thailand was pressured by lower sales. This was partly compensated by better margin in Malaysian car dealers, driven by higher car sales.
Selling and Administrative Expenses
Selling and administrative expenses increased by 5.6% year on year, mainly attributable to increased level of fixed costs in the automotive parts segment and a Baht 22 million exchange rate loss related to the derivative agreements in 2015, as compared to a gain recorded as other income in 2014. The cost level of the car dealerships segment remained relatively stable compared to last year.
Earnings
Earnings before interest and taxes (EBIT) decreased year on year, from Baht 488 million in 2014 to Baht 387 million in 2015. In percentage of revenue, EBIT margin also decreased from 3.2% in 2014 to 2.6% in 2015. This reduction of earnings was mainly due to lower sales, lower scrap income, and an exchange rate loss.

After adjustment for depreciation expense and include associate income, EBITDA in 2015 was Baht 1,280 million, compared to Baht 1,343 million in 2014. EBITDA margin in 2015 was at 8.5% of revenue, compared to 8.8% of revenue in 2014.
Share of profit from investments in associates and joint venture
| Unit : Million Baht | Y2014 | Y2015 | Change | % |
| Hyundai | 107 | 89 | (18) | -17% |
| Able Sanoh | 20 | 74 | 54 | 270% |
| Thai Takagi Seiko | 3 | (20) | (23) | -767% |
| Quantum Inventions | (1) | 8 | 9 | 900% |
| Other | (5) | (3) | 2 | 40% |
| Associate income | 129 | 148 | 19 | 14.7% |
Major contributors of profit in 2015 were Hyundai and Able Sanoh. Compared to 2014 performance, Able Sanoh’s profit notably increased, driven by higher sales, which were partly due to some new projects in 2015, followed by better results from Quantum Inventions. These increases were partly offset by lower profit from Hyundai, which was effected by weak domestic demand and a loss from Thai Takagi Seiko.
Finance Costs and Income Tax Expenses
| Unit : Million Baht | Y2014 | Y2015 | Change | % |
| Finance costs | 208 | 170 | (38) | -18% |
| Income tax expenses | 23 | 27 | 4 | 17% |
| Finance and Tax | 231 | 197 | (34) | -14.7% |
The Company has continuously reduced its finance costs over the years and recorded a reduction of Baht 38 million in 2015. This was mainly due to the reduction of interest bearing debts level as well as low interest rate on new fundings, both from banks and from the issuance of debenture in 2015.
Income tax expenses, largely related to the Malaysian car dealerships operations, increased by Baht 4 million compared to 2014.
Net Profit
| Unit : Million Baht | Y2014 | Y2015 | Change | % |
| Net Profit | 386 | 338 | (48) | -12.4% |
| Net Profit Margin % | 2.5% | 2.3% | -0.3% | |
| Minority Interest | 19 | 25 | 6 | 31.6% |
| Net Profit to Equity Holders | 367 | 313 | (54) | -14.7% |
| Net Profit Margin % | 2.4% | 2.1% | -0.3% | |
| EPS | 1.14 | 0.97 | (0.17) | -14.7% |
Net profit of the Company decreased year on year by Baht 48 million, almost all of which attributable to lower profit in the automotive parts segment, as a result of lower scrap income and foreign currency exchange fluctuation, despite improved gross profit margin, lower interest costs, and higher share of profit from associates.
Excluding the minority interest portion, net profit attributable to equity holders in 2015 were Baht 313 million or at 2.1% of revenue. On a per share basis, earnings were at Baht 0.97 per share in 2015.
Financial Standing Analysis
As of December 31, 2015, the Company has total assets of Baht 11,507 million, comprising of total liabilities of Baht 5,524 million and shareholders’ equity of Baht 5,983 million.
Assets
| Unit : Million Baht | Y2014 | Y2015 | Change | % |
| Receivable | 1,900 | 1,912 | 12 | 0.6% |
| Inventories | 1,209 | 1,109 | (100) | -8.3% |
| Current Assets | 3,822 | 3,683 | (139) | -3.6% |
| Investment in associates | 1,384 | 1,445 | 61 | 4.4% |
| Goodwill | 235 | 235 | - | 0.0% |
| PPE | 6,318 | 5,847 | (471) | -7.5% |
| Non-Current Assets | 8,260 | 7,824 | (436) | -5.3% |
| Total Assets | 12,082 | 11,507 | (575) | -4.8% |
Total assets decreased by Baht 575 million, mainly from decreases of property, plant and equipments, primarily as a result of depreciation, and lower inventory level compared to last year.
In 2015, the Company has continued monitoring the control of inventories and receivables. The average collection period hence further improved by 4 days, from 51.7 days in 2014 to 47.4 days in 2015, and the average inventory holding period was shorten by 1 day, from 31.3 days to 30.2 days.
Liabilities and Shareholders’ Equity
Total liabilities decreased by Baht 877 million, mainly attributable to a Baht 515 million decrease of debt level and decreases of trade and other payable.
The average payable period was slightly faster than last year by 1 day, from 57.3 days in 2014 to 56.0 days in 2015.
The loan outstanding with banks has continuously decreased during the year to Baht 2,483 million at the end of 2015. This was due to prepayment of long term loans, in addition to the regular repayment schedule, as a measure to reduce financing costs. Offsetting the decrease of bank loans, was the issuance of the 3 year debenture at a nominal value of Baht 800 million in April 2015, according to the Company’s finance strategy to diversify its source of funds portfolio. This debenture will be due in full amount in 2018.
| Unit : Million Baht | Y2014 | Y2015 | Change | % |
| Trade and Other Payables | 2,318 | 1,978 | (340) | -14.7% |
| Short-Term borrowings | 737 | 655 | (82) | -11.1% |
| Current portion of LT loans | 1,168 | 923 | (245) | -21.0% |
| Long-term Loans | 1,891 | 905 | (986) | -52.1% |
| Debenture | - | 798 | 798 | |
| Interest-bearing Debts | 3,796 | 3,281 | (515) | -13.6% |
| Total Liabilities | 6,401 | 5,524 | (877) | -13.7% |
| Total Shareholders’ Equity | 5,681 | 5,983 | 302 | 5.3% |
Total shareholders’ equity increased by Baht 302 million, maily attributable to retained profit for the year. In 2015, the Company has paid out dividend at the amount of Baht 64 million.
Key Financial Performance
| Profitability Ratio | Y2014 | Y2015 | Change |
| Return on Assets (%) | 3.1% | 2.9% | -0.3% |
| Return on Equity (%) | 6.9% | 5.8% | -1.1% |
The Company’s return on assets (ROA) and return on equity (ROE) have declined year on year, mainly due to lower profit of the Company, which has decreased from Baht 386 million to Baht 338 million.
| Liquidity Ratio | Y2014 | Y2015 | Change |
| Debt : Equity Ratio (time) | 0.67% | 0.55% | (0.12)% |
| Current Ratio (time) | 0.87% | 0.99% | 0.13% |
Despite the weaker profitability performance, the Company has continuously improved its liquidity management with the reduction of obligations with banks. The interest bearing debt to equity ratio has improved to 0.55 times in 2015, achieving the Company’s target of long term funding structure at around 0.5-0.6 times. The current ratio has improved from 0.87 times in 2014 to 0.99 times in 2015, with the reduction of current obligations to match its liquid funds.
| Debt Service Ratio | Y2014 | Y2015 | Change |
| Interest Coverage | 2.97% | 3.15% | 0.18% |
| Debt Service Coverage | 0.98% | 1.17% | 0.20% |
The Company also improved its ability to service debt obligation. Despite the weaker profitabilty performance, the improvement was entirely attributable to the reduction of debt obligations at the beginning of the year and hence reducing interest expenses. As a result, the interest coverage ratio has improved from 2.97 times in 2014 to 3.15 times in 2015.
The debt service coverage ratio (DSCR) has also improved from 0.98 times in 2014 to 1.17 times in 2015. The DSCR in 2015 was still below the banks’ requirement, which requires the Company to maintain this ratio at above 1.2 times, and the Company has received the bank waiver for the breach of financial covenants for the year 2015.
Cash Flow Analysis
The Company’s cash and cash equivalent amount increased by Baht 24 million, from Baht 314 million in 2014 to Baht 338 million in 2015.
| Unit : Million Baht | Y2014 | Y2015 | Change | % |
| Cash from Operating | 1,637 | 927 | (710) | -43.4% |
| Cash from Investing | (376) | (144) | 232 | -61.7% |
| Cash from Financing | (1,162) | (745) | 417 | -35.9% |
| Translation adjustments | (23) | (13) | 10 | -43.5% |
| Net cash increase | 76 | 25 | (51) | -67.1% |
| Cash Balance | 314 | 338 | 24 | 7.6% |
During the year, cash flow from operations decreased by Baht 710 million, mainly due to lower earnings, as compared to 2014 and partial receipt of cash from insurance income in 2014. The lower cash flow from operations was compensated by decreases of cash used in investing and financing activities by Baht 232 million and Baht 417 million respectively. Main activities that used lower cash were the decrease of capital expenditures by Baht 187 million, the decrease of net repayment of debts by Baht 318 million, the decrease of interest payment by Baht 47 million and lower dividend payment in 2015 by Baht 45 million.
Major factors and influences potentially affecting future operations or financial standing
The financial results and operations of the Company and its subsidiaries are greatly attached to the development of automotive industry and car markets in Thailand and Malaysia. The demand for vehicle production volume is an important driver for the manufacture of automotive parts business in Thailand, where its performance is inclinded to move in the same trend as the industry’s performance. The trend of domestic demand is an indicator for the car dealerships business in Thailand and Malaysia.
Looking forward, Thailand’s total vehicle production volume is forecasted to reach 2 million units in 2016, representing an increase of 4-5% year on year. This increase is expected to be driven by export growth, which is forecasted to increase to 1.25 million units in 2016. With the implementation of AEC, it is believed that Thailand’s position as the leading automotive manufacturing hub in ASEAN will be strengthen.
Thailand’s domestic car market is however less encouraging. The negative effects of the 1st car campaign is expected to still linger on in 2016, as well as the high household debt and weak agriculture produce price. The latter may also be further impacted by the draught issue. In addition, a new regime tax based on CO2 emission instead of engine size effective from January 2016 is also expected to affect market demand, as an anticipated higher car price may further decrease an overall sales numbers in 2016.
For the Malaysian market, it is anticipated that the volatility of Ringgit and the implementation of Goods and Service Tax in 2015 will have an impact over the overall economy in 2016. The announced car price increases by most major brands for January 2016 may result in a dip in TIV in 2016.
The Company closely monitors the development of economy and the automotive industry and preparing for challenges ahead. The Company will continue its focus on controling cost activities and cost reduction measures, as well as efficiency improvement in order to achieve a lean and cost effective manufacturing process. The Company is also seeking new opportunities and exploring new markets for profitable growth, either throught is own investments or with joint venture partners. The Company is also gearing towards sustainability growth with emphasis on quality, cost, delivery, management and engineering innovation to achieve customers’ targets, and as well as continuous improvements in all companies.
| Year 2025 | File Size | Download |
| Management Discussion & Analysis Q4/2025 | 314 KB. |
|
| Management Discussion & Analysis Q3/2025 | 331 KB. |
|
| Management Discussion & Analysis Q2/2025 | 325 KB. |
|
| Management Discussion & Analysis Q1/2025 | 232 KB. |
| Year 2024 | File Size | Download |
| Management Discussion & Analysis Q4/2024 | 286 KB. |
|
| Management Discussion & Analysis Q3/2024 | 284 KB. |
|
| Management Discussion & Analysis Q2/2024 | 297 KB. |
|
| Management Discussion & Analysis Q1/2024 | 242 KB. |
| Year 2023 | File Size | Download |
| Management Discussion & Analysis Q4/2023 | 288 KB. |
|
| Management Discussion & Analysis Q3/2023 | 486 KB. |
|
| Management Discussion & Analysis Q2/2023 | 494 KB. |
|
| Management Discussion & Analysis Q1/2023 | 244 KB. |
| Year 2022 | File Size | Download |
| Management Discussion & Analysis Q4/2022 | 312 KB. |
|
| Management Discussion & Analysis Q3/2022 | 250 KB. |
|
| Management Discussion & Analysis Q2/2022 | 2.08 MB. |
|
| Management Discussion & Analysis Q1/2022 | 266 KB. |
| Year 2021 | File Size | Download |
| Management Discussion & Analysis Q4/2021 | 301 KB. |
|
| Management Discussion & Analysis Q3/2021 | 275 KB. |
|
| Management Discussion & Analysis Q2/2021 | 1.60 MB. |
|
| Management Discussion & Analysis Q1/2021 | 258 KB. |
| Year 2020 | File Size | Download |
| Management Discussion & Analysis Q4/2020 | 1.27 MB. |
|
| Management Discussion & Analysis Q3/2020 | 1.86 MB. |
|
| Management Discussion & Analysis Q2/2020 | 1.53 MB. |
|
| Management Discussion & Analysis Q1/2020 | 1.02 MB. |
| Year 2019 | File Size | Download |
| Management Discussion & Analysis Q4/2019 | 405 KB. |
|
| Management Discussion & Analysis Q3/2019 | 2.54 MB. |
|
| Management Discussion & Analysis Q2/2019 | 427 KB. |
|
| Management Discussion & Analysis Q1/2019 | 149 KB. |
| Year 2018 | File Size | Download |
| Management Discussion & Analysis Q4/2018 | 946 KB. |
|
| Management Discussion & Analysis Q3/2018 | 160 KB. |
|
| Management Discussion & Analysis Q2/2018 | 1.15 MB. |
|
| Management Discussion & Analysis Q1/2018 | 707 KB. |
| Year 2017 | File Size | Download |
| Management Discussion & Analysis Q4/2017 | 206 KB. |
|
| Management Discussion & Analysis Q3/2017 | 276 KB. |
|
| Management Discussion & Analysis Q2/2017 | 174 KB. |
|
| Management Discussion & Analysis Q1/2017 | 147 KB. |
| Year 2016 | File Size | Download |
| Management Discussion & Analysis Q4/2016 | 147 KB. |
|
| Management Discussion & Analysis Q3/2016 | 151 KB. |
|
| Management Discussion & Analysis Q2/2016 | 141 KB. |
|
| Management Discussion & Analysis Q1/2016 | 138 KB. |
| Year 2015 | File Size | Download |
| Management Discussion & Analysis Q4/2015 | 136 KB. |
|
| Management Discussion & Analysis Q3/2015 | 144 KB. |
|
| Management Discussion & Analysis Q2/2015 | 135 KB. |
|
| Management Discussion & Analysis Q1/2015 | 133 KB. |
| Year 2014 | File Size | Download |
| Management Discussion & Analysis Q4/2014 | 136 KB. |
|
| Management Discussion & Analysis Q3/2014 | 136 KB. |
|
| Management Discussion & Analysis Q2/2014 | 52 KB. |
|
| Management Discussion & Analysis Q1/2014 | 51 KB. |